雅思写作9分范文:四个国家的人口变化
The chart below shows the percentage of the whole population in four countries
from 1950-2002, with projections to 2050.
Write a report for a university professor (1 50 words minimum) by summarizing the
presented information by selecting and reporting on the main features and make
comparisons.

Sample Answer [172 words]
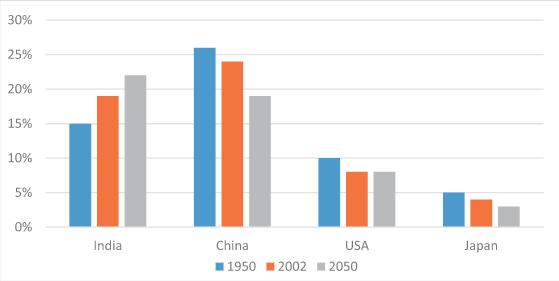
The column chart depicts the ratio of world population, India, China, USA and Japan from 1950 to
2002, with a prediction for 2050. The vertical axis is measured as a percentage while the horizontal
axis presents the nations.
Overall, it can be seen China was the most populous country, which later steadily declines; however,
this is in contrast to India. The United States and Japan recorded slight decreases, though the number
of American citizens could stabilize in 2050.
In 1950, China recorded the highest figure at 26%,while India was considerably lower at 15%.
America was two-thirds that of India, and Japan at one-third or 5%. However, by 2002 all populations
decreased by approximately 3%, except for India, growing substantially to peak at 19%.
Consequentl, by 2050 it is thought India's population will exceed China's, growing steadily to 21%.
On the other hand, China will drop to 18%, which if true, will be a dramatic fall. Japan's figures are
expected to decrease, but only slighty to 3% while America stabilizes at 13%.


